Repricings for block proving (Part 2: The tools and process)
Thanks, Cody, Vitalik, Kev, Pari, Conner, Ladislaus, Marius, and Maria for their feedback
In a previous article in this series, we explored the motivation behind block-proving benchmarking efforts. In this second part, we dive into the tooling we created and the process for interpreting the measurements (with some tentative results).
Refreshing the goals
Before jumping into the details, let’s clarify our goals and requirements:
- We want to measure worst-case scenarios, as these are the only metrics relevant for gas repricing.
- We are interested in open-source zkVMs that support standardized targets. In the short term, we can benchmark those zkVMs working towards that goal, but we should consider only zkVMs intended for mainnet production—including others would skew repricing conclusions.
- The tools and processes for measuring and analyzing results should be open-source and easy to reproduce.
- The guest programs used for measurements should be the EL clients maintained by their respective teams. Temporarily, we can experiment with modifications if the changes are planned to be upstreamed.
These bullet points reflect our team’s preferences, but all of our testing infrastructure is sourced so that others can benchmark on forked EL clients or non-open-source provers.
Proving throughput
The starting point for a block-proving repricing effort is defining the minimum required proving throughput—the rate at which gas can be proven, measured in gas per second. For example, if the gas limit is 60M gas and the maximum proving time is 8 seconds, then we need at least 60M/8s = 7.5 Mgas/s (million gas per second) proving throughput. If the proving throughput for any block case is less than this number, the proof generation time will exceed our limit.
This throughput framing helps interpret benchmark results. For example, if a MULMOD-heavy block uses 30M gas but takes 15s to prove, its throughput is only 2 Mgas/s. Comparing this to the 7.5 Mgas/s target gives a ratio of ~3.75x—suggesting MULMOD may need roughly a 3-4x price increase. When the benchmark isolates a single operation well, this ratio is a strong signal for purpose-built optimizations or repricing.
This model can be used to test whether repricing proposals achieve the desired range for every opcode. The most reliable approach is to set new prices and re-run the entire dataset, since fixtures (i.e., test benchmarks targeting operations) are not fully independent in their opcodes.
The benchmarking stack
Previously, tooling for benchmarking Ethereum blocks in zkVMs was virtually nonexistent. We decided to start from scratch and build the necessary tooling.
The benchmarking stack consists of three main components:
- eth-act/ere: a library that encapsulates the complexity of proving programs across different zkVMs.
- eth-act/zkevm-benchmark-workload: a tool that benchmarks Ethereum blocks using ere. It has a high focus on easily running the worst-case blocks built in ethereum/execution-specs. It collects relevant metrics (proving times, execution-only runs, etc.) for various EL/zkVM combinations.
- eth-act/zkevm-benchmark-runs: a repository for collecting benchmark results and analyzing data, mainly focused on repricings or other protocol changes.
Quickstart: Proving worst-case blocks
While each repository has its own documentation (have a look!), here is a quick overview of how to run the benchmarks across different EL/zkVM combinations. There is no need to run this to continue reading the article — it is mostly shown to give concrete steps if you want to try it out.
This is all you need to run:
# Assuming Docker and git are installed.

$ git clone https://github.com/eth-act/zkevm-benchmark-workload
$ cd zkevm-benchmark-workload

# 1. Generate guest program inputs for all spec benchmarks.
# Note: Change --include to select gas limits like 10M, 30M, or 60M.
# Outputs are stored in `zkevm-fixtures-input`.
$ RAYON_NUM_THREADS=8 RUST_LOG=info cargo run -p witness-generator-cli --release --tests --include 10M-

# Option 1: zkVM Execution Only (No proving)
# Execute fixtures in EL/zkVM combinations to check for crashes or limits.
$ RAYON_NUM_THREADS=2 RUST_LOG=info,"prove core"=warn cargo run --release -p ere-hosts -- --zkvms openvm --zkvms sp1 --zkvms zisk stateless-validator --execution-client reth

# Option 2: GPU Proving
# Prove fixtures in selected EL/zkVM combinations.
# Requires CUDA Toolkit (with drivers) and NVIDIA Container Toolkit.
$ RUST_LOG=info cargo run --release -p ere-hosts -- --zkvms zisk --action prove --resource gpu stateless-validator --execution-client reth

# For both options, the results of runs will be in `zkevm-metrics` folder.
Initial execution or proving may be slow due to the construction of Docker images for the targeted zkVMs. Ere also supports non-Dockerized setups; however, this shifts the burden to the user to install the necessary zkVM SDKs and corresponding prerequisites. We plan to research further whether there is significant overhead in using Docker compared to a non-Dockerized setup.
Some extra notes:
- Until standardization efforts are implemented within ELs and zkVMs, the workload repo handles the complexity of maintaining guest programs and applying zkVM precompiles.
- Currently, only worst-case scenarios for Prague fork are available, but we are collaborating to support Osaka soon.
- As we broaden ere compilation capabilities and EL teams work on compiling to RISC-V, more EL clients will be included.
The dataset
Before diving into measurements and dashboards, let's clarify what we're measuring and how it helps us reach repricing conclusions.
The dataset consists of benchmark blocks constructed in ethereum/execution-specs. This aims to be a set of Ethereum blocks with a configurable gas limit target that covers:
- Isolated opcode and precompile execution: blocks that consume the target gas limit using a single opcode or precompile.
- Exploit protocol weaknesses: situations that are challenging to prove, e.g., stressing current unchunkified bytecode.
- Challenging inputs: specially crafted opcode and precompile inputs known to be expensive in actual implementations.
The spec benchmarks are designed by:
- Setting a block gas target (e.g., 10M, 60M, 120M gas).
- Creating a block that targets a specific opcode, precompile, or scenario, attempting to consume as much gas as possible using only that operation.
Note that perfectly isolating an opcode is impossible. A valid block requires "glue opcodes" (like PUSH, POP, or JUMP) to manage the stack and pass arguments. These are kept as minimal as possible, with multiple tricks—the better the isolation, the higher the signal the benchmark provides that the target operation might be mispriced.
Each opcode, precompile, or scenario usually has more than one benchmark, because:
- Many opcodes with fixed gas costs can have different real costs depending on inputs, so it is worth covering different cases (e.g. MULMOD).
- They have dynamic gas costs (e.g. SSTORE/SLOAD), so we need different cases.
By benchmarking these blocks, we can detect scenarios where performance deviates from expectations. If gas prices are correct, blocks with the same gas usage should take a similar time to prove. When a block takes disproportionately longer, it signals that the target operation may be mispriced. This might happen only in some zkVMs or in all of them — different zkVMs can be better or worse than others at different operations, i.e. the same as ELs in re-execution. If this occurs across all platforms, it likely indicates that the operation is inherently difficult to prove.
Maintaining benchmarks in ethereum/execution-specs is a community effort involving people inside and outside the EF, both for re-execution and proving benchmarking. Please help the project by reviewing and implementing any missing benchmarks or relevant scenarios!
Benchmark runs
With the benchmark tools and dataset ready, let’s review the benchmark runs we’ve made and think through how to interpret the results.
We have made runs with two prover setups:
- 1x NVIDIA L40S - AMD EPYC-Milan Processor, 125GB RAM
- 8x NVIDIA GeForce RTX 5090 - AMD EPYC 7B13 64-Core Processor, 503GB RAM
These hardware setups are cloud-based (i.e., have some degree of virtualization) and weren’t finely tuned in any specific way.
Regarding the ELs used, we have integrated:
- reth@cfde951 with Risc0 sparse Merkle Patricia Trie (upstreaming this tree implementation is under consideration, and other optimized implementations are being explored).
- ethrex@35397ff without external components.
The runs were performed using the zkevm-benchmark-workload repository mentioned earlier, and the results were uploaded to zkevm-benchmark-runs. The output format is simple and allows us to create any data analysis pipeline or UI tool, depending on what we want to explore.
For now, we have created two main dashboards (which we will explain soon):
- Execution and proving times dashboard
- Gas repricing dashboards
The dashboards are automatically generated for any new commit pushed into zkevm-benchmark-runs. Note that these are the early days of data analysis, and in the upcoming weeks/months, these dashboards might change or be replaced with better analysis tools.
Execution and proving times dashboard
This zkEVM Benchmark Results dashboard is a straightforward way to view benchmark measurements in a more readable format than JSON files. It has tabs to toggle between three different dashboards, with the following two being the most important ones:
- Execution: shows fixture runs in execution-only mode, i.e., not proving, but only RISC-V emulation and execution trace generation.
- Proving: shows full proof generation times under different datasets (mainnet, worst-case sets) and different prover hardware setups.
In this section, we will primarily focus on the Execution tab.
In Part 1, we discussed crash faults arising from zkVM design limits. To catch many of these faults, we don’t need to generate full proofs; we only need to run the RISC-V emulation phase. Doing so involves executing the block on an emulated RISC-V CPU to create the execution trace and witness data required for the prover.
If the execution hits a cycle limit, exceeds zkVM memory usage (i.e., not the host memory!), or exceeds guest program input size limits, the emulator will fail. Doing execution-only runs allows for rapid iteration: emulation is orders of magnitude faster than full proving, which can take minutes unless you have a big proving cluster.
We executed worst-case blocks at 10M, 30M, and 60M gas—the absolute minimum required to surface existing issues. However, we can test much higher limits (e.g., 100M or 120M) simply by adjusting the --include flag mentioned in the previous Quickstart: Proving worst-case blocks section.
The results of these execution-only runs are available here: 10M gas, 45M gas, and 60M gas. You can filter by EL to dig deeper. A "crash" result means the zkVM failed during execution (and thus can’t create a proof)—no amount of hardware will help.
Note that the main high-signal metric in the Execution tab of the dashboard is the SDK Crash count. "Execution Time" seconds is a red herring for performance or repricing, since other phases in full proof generation can be pipelined with the RISC-V emulation phase. The Proving tab shows the full e2e latency of real proof generation.
You might wonder why we run 10M and 45M gas cases when the current 60M gas limit is most relevant. Lower limits help us understand at which thresholds fixtures start crashing, and how FOCIL's potential gas limits relate to worst-case scenarios.
We won’t go into the full details of each crash reason, but here are some high-level explanations:
- Some zkVMs crash due to maximum execution length limits; this can happen in some precompiles even with 10M gas, and in a broader set of fixtures at 60M gas.
- Un-chunkified bytecode in worst-case scenarios triggers guest program input size limits; you can see them triggered by call-family opcodes (CALL, CALLCODE, DELEGATECALL, STATICCALL), EXTCODESIZE, and EXTCODECOPY).
- Even when the zkVM doesn’t crash during the execution phase, we still observe long running times, which are a lower bound on proving times. These could be improved with a more fundamental re-architecture of EL clients in stateless mode.
We have already contacted some zkVM teams to share these findings. As mentioned in the previous article, this is not due to their design—the worst-case spectrum in Ethereum was never fully explored, so many decisions in zkVM designs made sense without clear justification to do otherwise.
Some of these issues must be addressed at the protocol level, such as through gas repricings or chunkifying bytecode as part of a potential new state tree. Other issues are being addressed directly by the zkVM teams, and new releases may resolve some of the current crash faults.
Gas repricings dashboard
Another way to interpret raw proving times is to view them through the lens of the Proving throughput model section of this article above.. This lens is useful for reading the proving times to support decision-making on repricings.
The Ethereum Proving Gas Repricing Analysis dashboard is a bit packed, so let’s explain a bit more about what it includes.
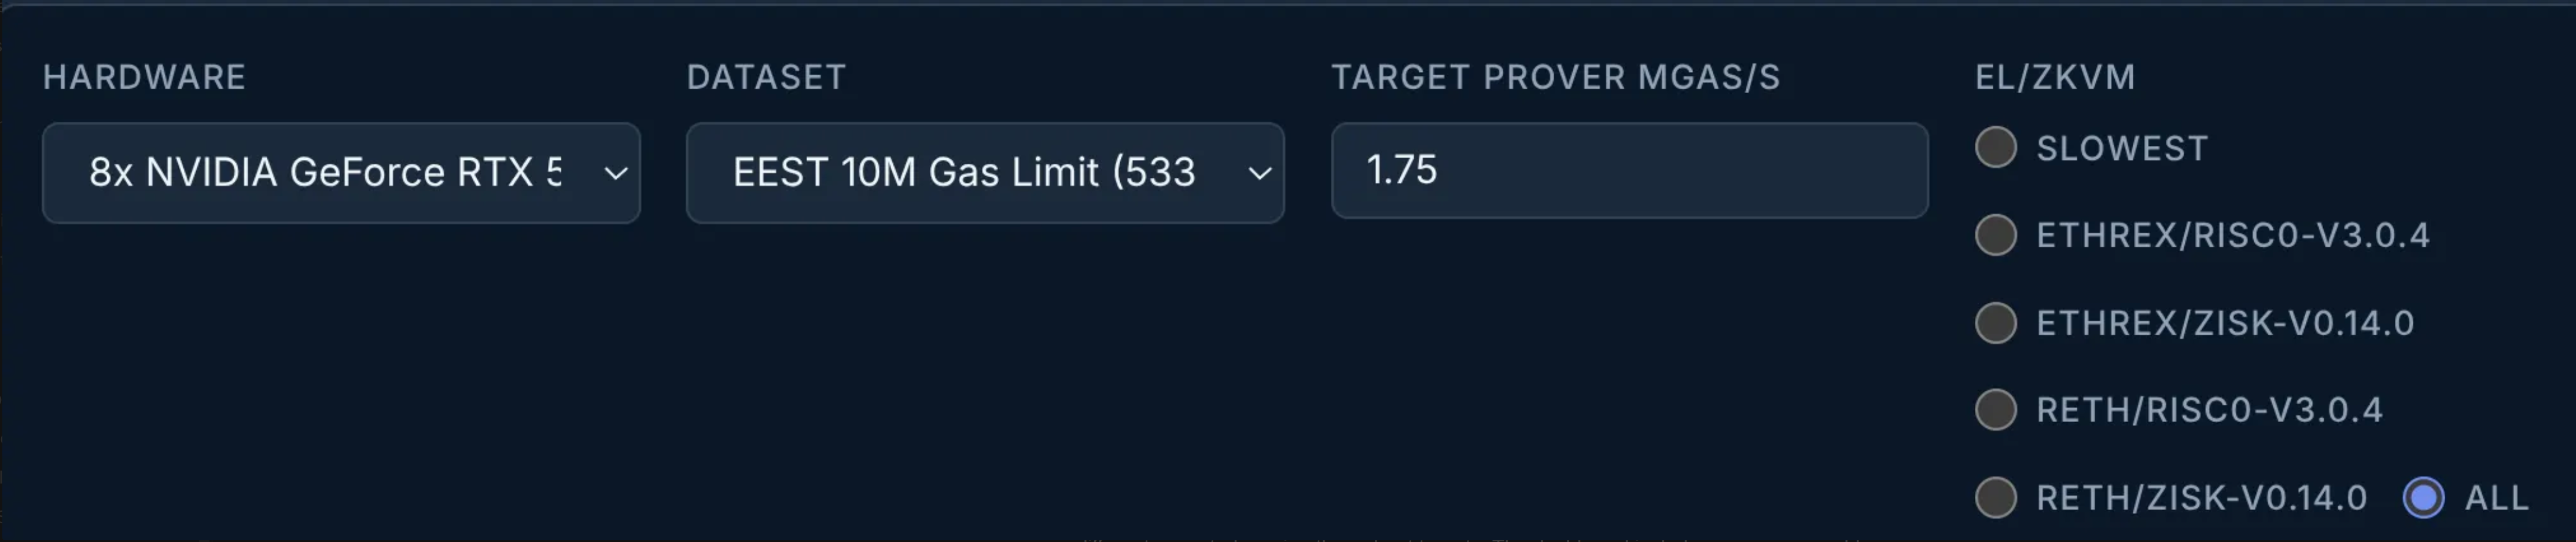
- The Hardware and Dataset comboboxes let us select which prover hardware and datasets we want to show results for.
- The EL/ZKVM radio buttons allow us to filter which EL/zkVM combinations to show. For example, Slowest lets us simplify the results if we only care about the slowest variant for each fixture.
- The Target prover Mgas/s parameter specifies the expected proving throughput for this hardware setup. For example, a single-GPU, 8-GPU, and 64-GPU setup would clearly have different expected proving throughput targets. The dashboard includes some reasonable default values.
Feel free to experiment with these filters.
The dashboard has many other filters and features, but let's look at some results to get a sense of the main Benchmark results table.
For 1xL40s and 5M gas, we can see, for example:
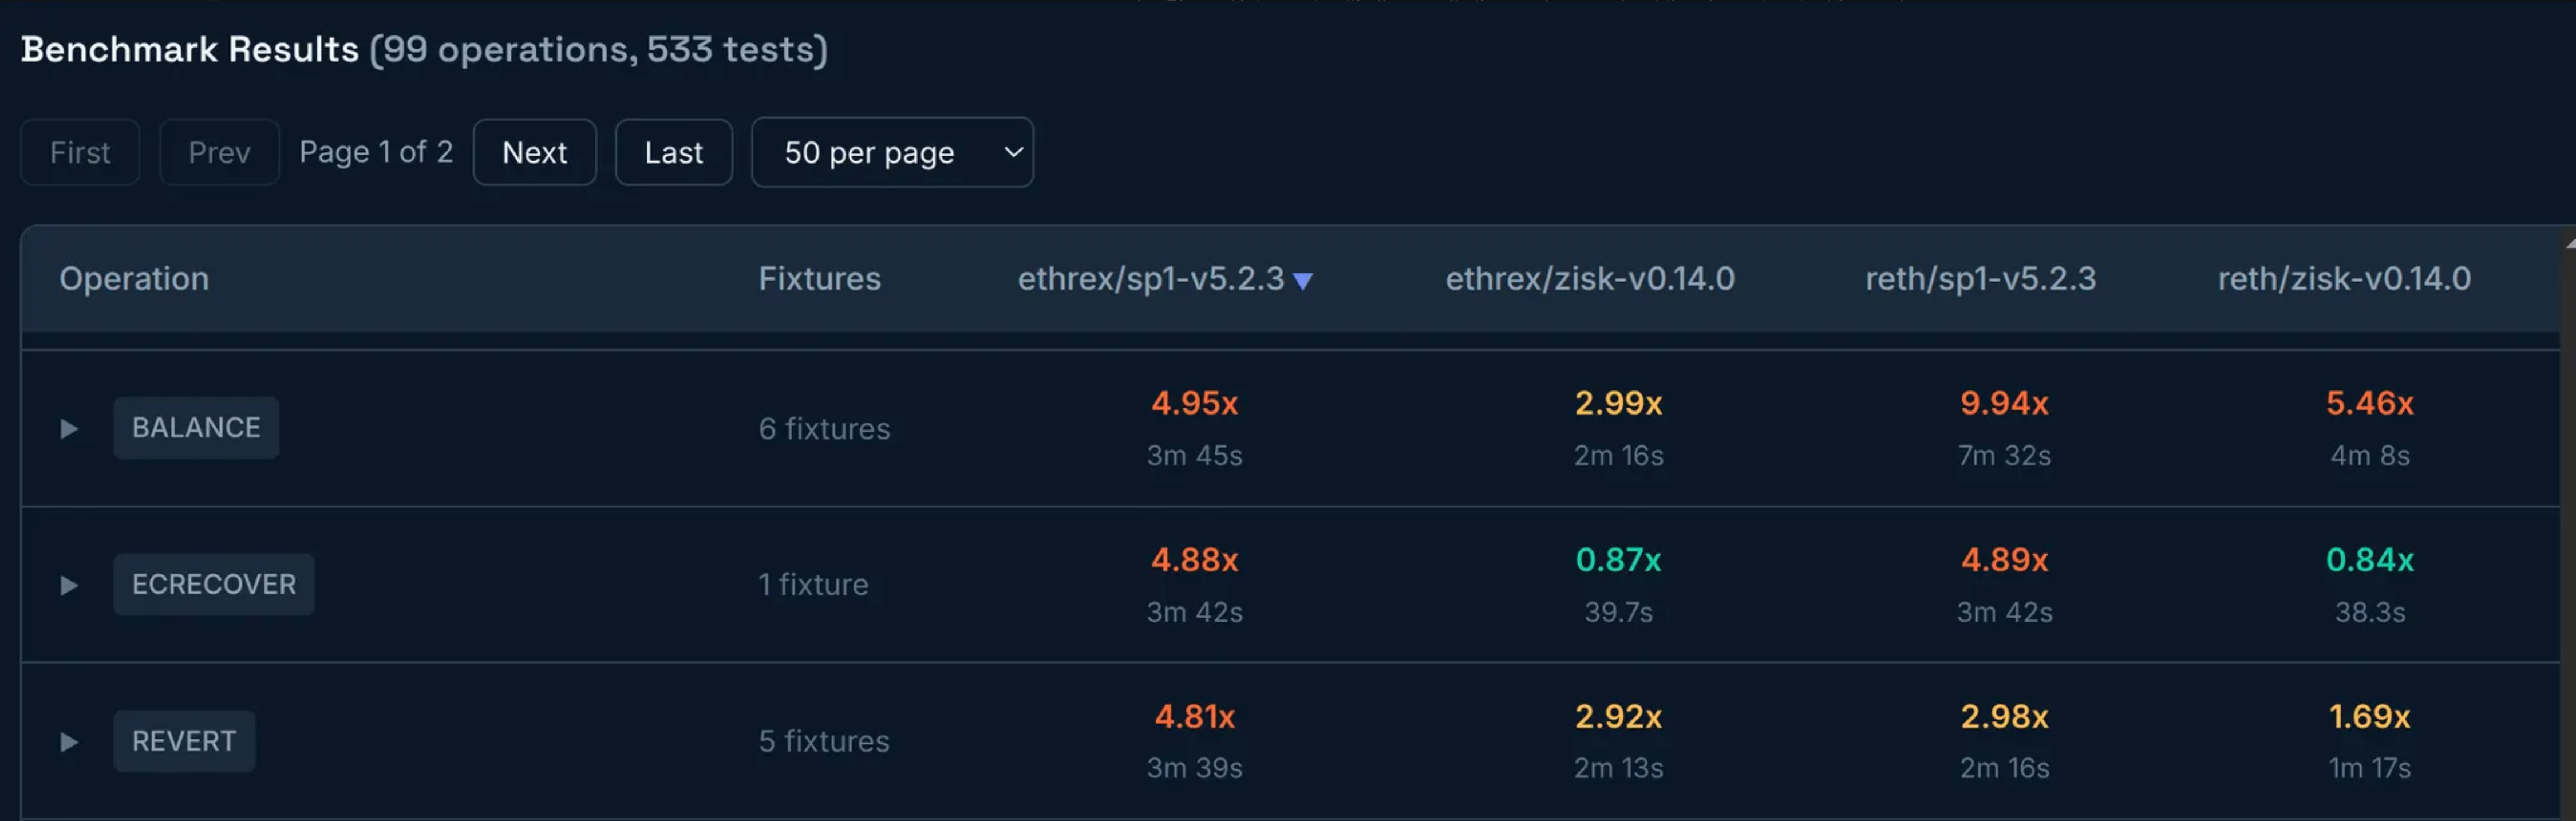
This table shows, for each target operation, the worst-case ratio of measured to target proving throughput across different EL/zkVMs. A ratio greater than 1x indicates the proving throughput is slower than expected (indicating potential underpricing), while a ratio less than 1x indicates it is faster than expected.
If you click the row, you can see more details for all fixtures related to the operation. The top-level table always shows the worst ratio from all the fixtures because we only care about the most challenging case for using opcodes/precompiles.
Beyond repricing, this table helps identify optimization opportunities. If two ELs show different proving times on the same zkVM, the slower EL may have room to improve. Conversely, if one zkVM is slower than others for the same EL, that zkVM may have performance issues to address. Note that the goal isn't to push all ELs and zkVMs toward identical designs. Implementation diversity makes the ecosystem more robust against crashes and bugs, and a difference in performance (if not huge) is a reasonable price to pay for it.
Absolute vs marginal ratios
The Gas Repricing Analysis dashboard includes one extra feature to present results based on absolute or marginal throughput ratios.
When a block with a particular gas usage is proven, the underlying computation isn’t limited to the gas spent in the target opcode or precompile. It also includes other logic, such as system contract execution and input validation. All this work also affects proving time and can be treated as a fixed cost.
To isolate fixed costs, we compare proving times at different gas levels—say, 5M and 1M gas. The marginal throughput uses only the difference: (5M - 1M) = 4M gas, divided by the difference in proving times. This removes some fixed cost overhead from the calculation.
If you look at the 5M gas dataset for single-GPU, you will see something like this:

Clicking each radio button flips the interpretation of the results. Note that Marginal is enabled only for datasets other than the lowest-gas-use datasets, since it compares the current dataset with the next smallest available dataset.
Still, it isn’t entirely clear whether considering marginal costs is correct, because some parts of the proof aren’t linear (e.g. the aggregation step for shrinking proof sizes). In any case, the results don’t change that much between Absolute and Marginal, but might still be worth exploring further.
Important caveats to remember
Note that all measurements should be understood in context:
- Single-GPU runs may yield less signal than multi-GPU runs.
- 1M or 5M worst-case blocks might be low-gas-limit runs where fixed costs can dominate a significant portion of the proving times. This usually happens in single-GPU runs.
- Today, multi-GPU results are too often crashing, usually due to limitations being addressed in zkVMs (e.g. upcoming precompiles support, changes in their design, etc.).
The Gas Repricing Analysis dashboard will raise many questions about surprising results that warrant further analysis. Being surprised is the first step to understanding reality and acting on it.
Next steps
Doing realistic, fair benchmarking of any system is a significant engineering effort, with many small details that can make a big difference.
Three primary dimensions should be inspected and iterated on to keep converging into reliable measurements to reach conclusions for repricings:
- Maturing the dataset: worst-case scenarios should continue to be improved and further inspected for bugs that could affect measurements. For example, it could have better support for loads that require large state, like SLOAD/STORE deep branches. Current efforts for Glamsterdam repricings are already helping a lot on this front.
- Improving EL and zkVM integrations: further inspection is needed to ensure all available zkVM precompiles are correctly configured and supported in ELs. Also, as zkVMs continue to open-source their multi-GPU setups, they will be integrated into ere.
- Proving infrastructure fine-tuning: the prover hardware setup and configuration are crucial to have meaningful proving times. Aspects like bare-metal vs virtualized environments, CPU to GPU ratios, proper NUMA support, obscure zkVM flags for further fine-tuning, and others, can have a significant impact.
All points above represent a significant engineering effort that we can’t handle on our own in the zkEVM team, and we’ll need help from many other teams, including STEEL, pandaOps, devops, ELs, and the zkVM teams.
Apart from engineering efforts, there are other dimensions to consider:
- Mainnet proofs will likely use a k-of-n model, requiring k valid proofs from n different EL/zkVM combinations. For repricing, we need worst-case times for the slowest prover in this set, which isn't finalized yet.
- zkVM performance is tied to proof sizes and security parameters. Until these meet requirements, it's hard to predict how changes will affect proof times.
- Current Glamsterdam repricing efforts will conclude with new prices for many opcodes and precompiles. Until these prices are settled, the current ratios for proving repricings will change accordingly.
- We might need to target higher gas limits than 60M, since upcoming protocol changes could result in significant gas limit increases. Exactly how much the gas limit may increase by is still to be decided.
- As ELs and zkVM teams keep improving their implementations, this will also influence all ratios measured today.
For now, the dashboards are best used to identify which operations show strong signals of mispricing and to estimate rough repricing magnitudes. This article focuses on process and tooling so that as implementations evolve, we can re-measure and refine our conclusions.
Conclusion
In this article, we described the tools and workflows we built to create a reproducible pipeline for benchmarking worst-case Ethereum blocks. This pipeline helps us surface zkVM design limitations and identify what repricings are required to meet the throughput target.
Rather than running benchmarks behind closed doors and presenting a fully-baked repricing plan, we’re making the process transparent: outlining our approach, publishing the artifacts, and inviting others to reproduce the results. We hope this gives EL and zkVM teams concrete cases to investigate and optimize, as every improvement reduces pressure on repricing.
As we make more progress on many of the Next steps described previously, we will have measurements that are closer to a production-ready prover setup under the upcoming Glamsterdam assumptions. This will provide the confidence needed to reach conclusions about which protocol changes are required for repricings.
If you have any questions, feel free to contact anyone from our team, and participate in the EthR&D Discord server in #l1-zkevm and #l1-zkevm-protocol channels.